
Field notes Construction and mapping
What an aerial construction record shows, and what it doesn't
What a dated drone capture of a construction site measures, what makes two captures comparable, what a volume number is made of, and where the record fits.
- Topic
- Construction and mapping
- Field notes
- Published
- Sep 23, 2026
- Reviewed Sep 2026
- Sections
- 11
- With sources
- Sources
- 13
- Cited in full
What did you actually get?
A general contractor, a lender, an owner. Each one gets a file and asks the same thing. What is this, and what does it prove?
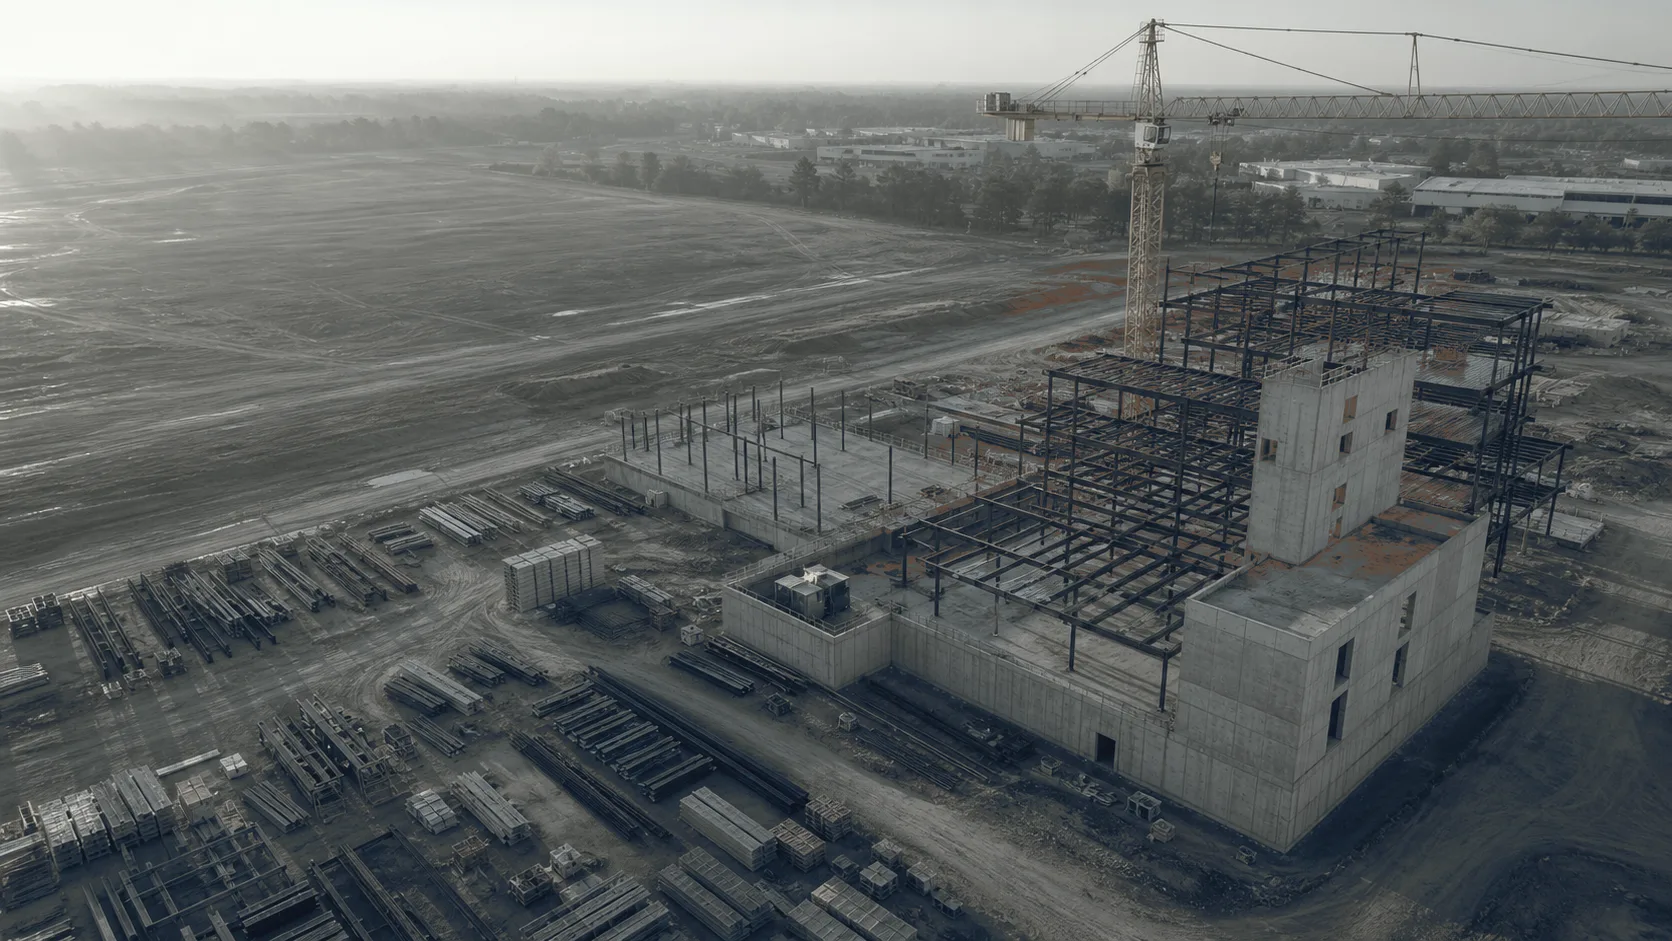
Here’s what it is. A dated capture of the site’s visible exterior conditions. From stated viewpoints, at a stated resolution, on a stated date. That sentence is the whole product, and every word in it does work.
It measures things. A surface model can tell you how much dirt moved between two dates. An orthomosaic can tell you where the footings sit against the layout. But measuring and proving aren’t the same. What the record can show is narrower than what people want it to show. This piece is about the line between them.
What “accurate” means when someone says it. What makes two flights comparable. What a volume number is made of, and why we don’t attach a percentage to it. What the record can’t show. And where it fits in the paperwork somebody else is responsible for.
If you came for one thing:
- What “accurate” means, and what it doesn’t
- What makes two captures comparable
- The volume number
- What it can’t show
- Where it fits in the record
- What you receive
What a dated capture is
The drone flies a grid over the site. Every photo overlaps the ones beside it, front and side. The same corner of a footing shows up in a dozen frames from a dozen angles.
Software finds those shared points. From where each one lands in each photo, it works out where the camera was for every shot. From the camera positions, it rebuilds the ground in three dimensions. That’s photogrammetry. Measurements from photographs.
Three products come out of it.
An orthomosaic. All the photos stitched into one image, corrected so it’s true to scale everywhere, like a map. You can measure distances on it.
A surface model. A grid of heights. Every point on the site with an elevation attached. Two surface models from two dates can be subtracted.
A point cloud. Millions of individual points, each with a position and a color. The raw three-dimensional record the other two are built from.
Two more things come with them, and they matter as much.
The source images, with their dates. Every photo the model was built from, with the time it was taken. If someone challenges the model, the photos are what it rests on.
The flight log. Height, overlap, camera settings, wind, light, control points, the software and the settings it ran. That isn’t a pilot’s private record. It’s part of the product. Without it, nobody can tell whether the next capture is comparable to this one.
What “accurate” means, and what it doesn’t
“Accurate to two inches.” You’ll hear that. Before it means anything, you need to know which of five things it is.
Resolution isn’t accuracy. Ground sample distance is how much ground one pixel covers. Fly lower, get smaller pixels, see finer detail. That’s how sharp the picture is. It says nothing about whether the picture is in the right place.
Fitting itself isn’t fitting the world. A model can agree with itself perfectly. Every distance inside it consistent, every height smooth. And still be shifted three feet east, or tilted, or the wrong height overall. That’s internal precision. It’s not the same as absolute accuracy, which is how well the model fits a stated coordinate system. A model that’s precise but not accurate looks great and overlays wrong.
Control points shape the model. Checkpoints test it. Control points are known positions on the ground that the software uses to pin the model down. Checkpoints are known positions the software never sees. You compare the model against them afterward. Only checkpoints tell you how accurate the product is. A residual on a control point tells you how well the model fit the thing it was already told.
RTK and PPK make the camera know where it was. Corrected satellite positioning puts each photo’s location within centimeters. That reduces how many ground points you need. It doesn’t test the finished model. The camera knowing its position is an input. Accuracy is an output, and it’s measured, not assumed.
A software report isn’t a test. Processing software prints a number when it’s done. That number describes how well the model fit its own inputs. It is not a comparison to anything independent.
So when someone says “accurate to two inches,” ask. Horizontal, vertical, or both? Tested against independent checkpoints, or expected from the equipment? How many checkpoints? The published standard for this work sets its accuracy classes on tested error against independent points. Thirty of them for a full assessment. Anything short of that is expected accuracy, and it should be called that.
What makes two captures comparable
Progress documentation is a series. The value is in the difference between one capture and the next. And the difference only means something if everything else stayed the same.
Here’s what has to hold constant, or be recorded when it doesn’t.
The boundary. Same site extent, same buffer past the edges.
The height, and so the resolution. Fly higher on the second visit and the pixels are bigger. The models won’t compare cleanly.
The overlap and the line direction. Same forward and side overlap. Same flight-line orientation.
The camera and its settings. Same camera, same lens, same focus and calibration treatment. Same shutter speed and exposure approach.
The coordinate system. Same horizontal datum, same vertical datum, same geoid model, same units. Change any one and the surfaces are in different worlds.
The control. Same ground points, in the same places. Same checkpoints.
The correction source. Same base station or correction service for the positioning.
The processing. Same software, same version, same significant settings, same surface-generation method, same output grid.
The comparison surface. When you subtract one model from another, the answer depends on two choices. Which one is the base, and how the two were clipped.
Change one of those and the difference between flights includes the change. Some of that is unavoidable. Wind on one day and calm on another. A tree in leaf on one visit and bare on the next. The log records it, and the comparison carries a note.
That’s why the flight log is a deliverable and not paperwork. Two flights with matching logs can be compared. Two flights without them are two pictures.
When it works
Photogrammetry wants clear weather and a good sun angle. Everything else works against it.
Wind moves the aircraft between shots and shifts loose material on the ground.
Haze and smoke flatten the image. Late-summer fire smoke in this part of the country can end a capture before it starts.
Long shadows hide detail and change between passes. Early morning and late afternoon look dramatic and match poorly.
Surfaces with no texture give the software nothing to match. Fresh asphalt. Smooth concrete. Still water. Bare metal roofing. The model thins out or drops holes there.
Dense foliage hides the ground. The model reads the canopy and calls it the surface.
Motion blur from flying too fast for the shutter leaves gaps. So does uneven overlap from wind or a bad plan.
A capture that fails these produces a model that looks fine and isn’t. The holes get filled by interpolation, the blur gets averaged, and the output looks like a surface. The flight log is where you find out it wasn’t.
The volume number
A stockpile volume is the simplest-sounding thing we deliver and the one with the most hidden in it.
Here’s how it’s made. The current surface, the one the drone just captured, minus a base surface, the ground the pile sits on. Inside a boundary drawn around the pile. That’s it. Three inputs.
Each one carries a decision the software report doesn’t show.
The base surface. Is it the ground from before the pile existed? A flat plane at the toe elevation? A surface from a previous flight? Each gives a different answer. On a pile sitting in a swale or on a slope, the difference is real.
The edge. Somebody draws the line where the pile stops. Two feet in or out along the toe of a large pile changes the number. The software doesn’t know where the pile ends. A person decides.
What got filled in. The back face of the pile the camera couldn’t see. Weeds along the toe. Equipment parked against it. The model fills those gaps by interpolation, and the fill is a guess.
None of that is a flaw in the method. It’s how the method works. A volume with its base surface, its boundary, its control, and its checkpoint results stated is a defensible number. A volume without them is a number.
Now the finding. Companies in this business quote accuracy percentages for drone volumes. We went looking for the study behind them. Something that compared drone volumes against a total station, a laser scan, or a weighed load. Under stated flight and control conditions, with the difference reported. Across state transportation departments and the journals where this gets published, we didn’t find one.
What we found is where the percentages come from. Processing software prints a statistic at the end of a run. It describes how well the model fit its own inputs. That statistic gets quoted as accuracy.
The percentage comes from the software, not from a test.
So this article doesn’t publish one. Not because volumes can’t be accurate. Because a number nobody has validated against something real isn’t a number you should put on a pay estimate. And we won’t hand you one dressed as if someone had.
What it can’t show
Plainly, so it’s settled before you buy a capture.
Concealed work. Rebar in a poured slab. Waterproofing under backfill. Conduit inside a wall. Once it’s covered, the camera sees the cover.
What a material is. A photo shows a surface. It doesn’t tell you the aggregate mix, the pipe class, or the membrane thickness.
Whether it was installed right. Workmanship is a judgment about what’s under, behind, and inside the visible thing. The record shows the visible thing.
Compliance. Nothing in a photogrammetric model says a wall meets code or a footing matches the drawings. Those are determinations someone qualified makes, against a document, on site.
It isn’t an inspection. The institutional inspection processes we looked at all have the same shape. An assigned inspector or consultant evaluates work against a program and produces specified records. The sources don’t classify a capture on its own as one of those. We document. Someone else inspects.
It isn’t a boundary or a benchmark. Nothing in the package locates a property line or certifies an elevation. That work is done by a licensed professional land surveyor, and we say so on every deliverable.
What the record does do: it fixes a date, a viewpoint, and a set of visible conditions. It measures what’s visible against stated control. And it does it the same way next month so the two can be compared. That’s a lot. It just isn’t proof of anything underneath.
Where it fits in the record
A capture is one document in a file someone else owns. Here’s where it goes, attributed to the programs that say so.
Draw inspections. How a lender confirms progress before releasing money differs by program, and there’s no universal version. Two examples from public guidance.
Fannie Mae’s multifamily guide, for construction it forward-commits on, assigns on-site progress inspections to a consulting architect. The architect issues a report after each inspection and whenever the construction lender approves a disbursement.
HUD’s 203(k) rehabilitation program runs differently. The borrower requests a draw inspection. A HUD-approved consultant and the borrower inspect the work together. The consultant certifies it’s satisfactory. Both sign the release, and the lender pays.
Different programs, different people, different sequences. Neither publishes a formula for percent complete, and we don’t imply one. A dated capture can sit in the architect’s or the consultant’s file. It’s evidence of what was visible on the date. It doesn’t replace their inspection.
Payment quantities. On federal-aid highway work, the Federal Highway Administration is specific. Support for payments should be in inspector reports, daily diaries, and engineering calculations. And it requires procedures to accurately determine quantities of completed work. A computed volume is an input to that. The engineer’s calculation, checked against the contract’s measurement method, is the record. Not the drone.
Disputes. FHWA lists dated photographs and video among the project records a contracting agency keeps, alongside diaries and change orders. That’s what a capture is in a claim file: a contemporaneous record of visible conditions on a date. AIA’s guidance on differing site conditions says to document the condition when it’s found, including with photographs. That’s the claim it supports — an unexpected condition, recorded when discovered. It isn’t a rule to photograph everything before it’s covered, and nobody should sell it as one.
A dated capture strengthens all three files. It fills none of them.
What you receive
The package, and what each piece is for.
The orthomosaic. One scaled image of the whole site. For measuring distances, checking layout, and showing someone what was there.
The surface model. Heights everywhere. For cut and fill, for comparison against the last flight, for volumes.
The point cloud. The full three-dimensional record. For anyone who wants to build their own surfaces or check ours.
The source images, dated. Every photo, with its timestamp.
The flight and processing log. Everything from the comparability list. Height, overlap, camera, control, checkpoints, software and settings.
Comparison overlays, where there’s a prior capture. The difference surface, and a note on anything that changed between flights.
The volume report, where a volume was asked for. The number, with its base surface, its boundary, its control method, and its checkpoint results stated. No percentage.
Then the formats. Named only where there’s a published specification behind the name.
GeoTIFF for the orthomosaic and the surface model. The open standard for a georeferenced image, version 1.1.
LAS for the point cloud. The open point-cloud exchange format from ASPRS. One honest note here. ASPRS published LAS 1.5 and an updated 1.4 in August 2025. The USGS lidar specification for 2025 still calls for the previous 1.4 revision. The current version of the standard and the version your recipient requires can differ. We deliver the one your spec names. LAZ is LAS, losslessly compressed, if you want smaller files.
GeoPackage for GIS users. One file holding the vectors, the imagery tiles, and the attributes, version 1.4.0.
LandXML for civil users. Surfaces, points, and alignments in the form design software reads.
PDF and CSV for the reports.
We also deliver DXF and shapefile where your software needs them.
If you want to talk about a site
A short call covers three things. What the record is for: progress, draw support, quantities, a dispute file. That sets the control and the base surface. Who’s receiving the outputs, and in what format their software reads. And whether there’s a prior capture to compare against, and whose.
We’re owner-operated. The person you talk to is the person who flies the site and signs the log.
If what you need is a certified quantity or a boundary, we’ll say so on the call. That’s a licensed professional land surveyor’s work, and we’ll help you find one.