
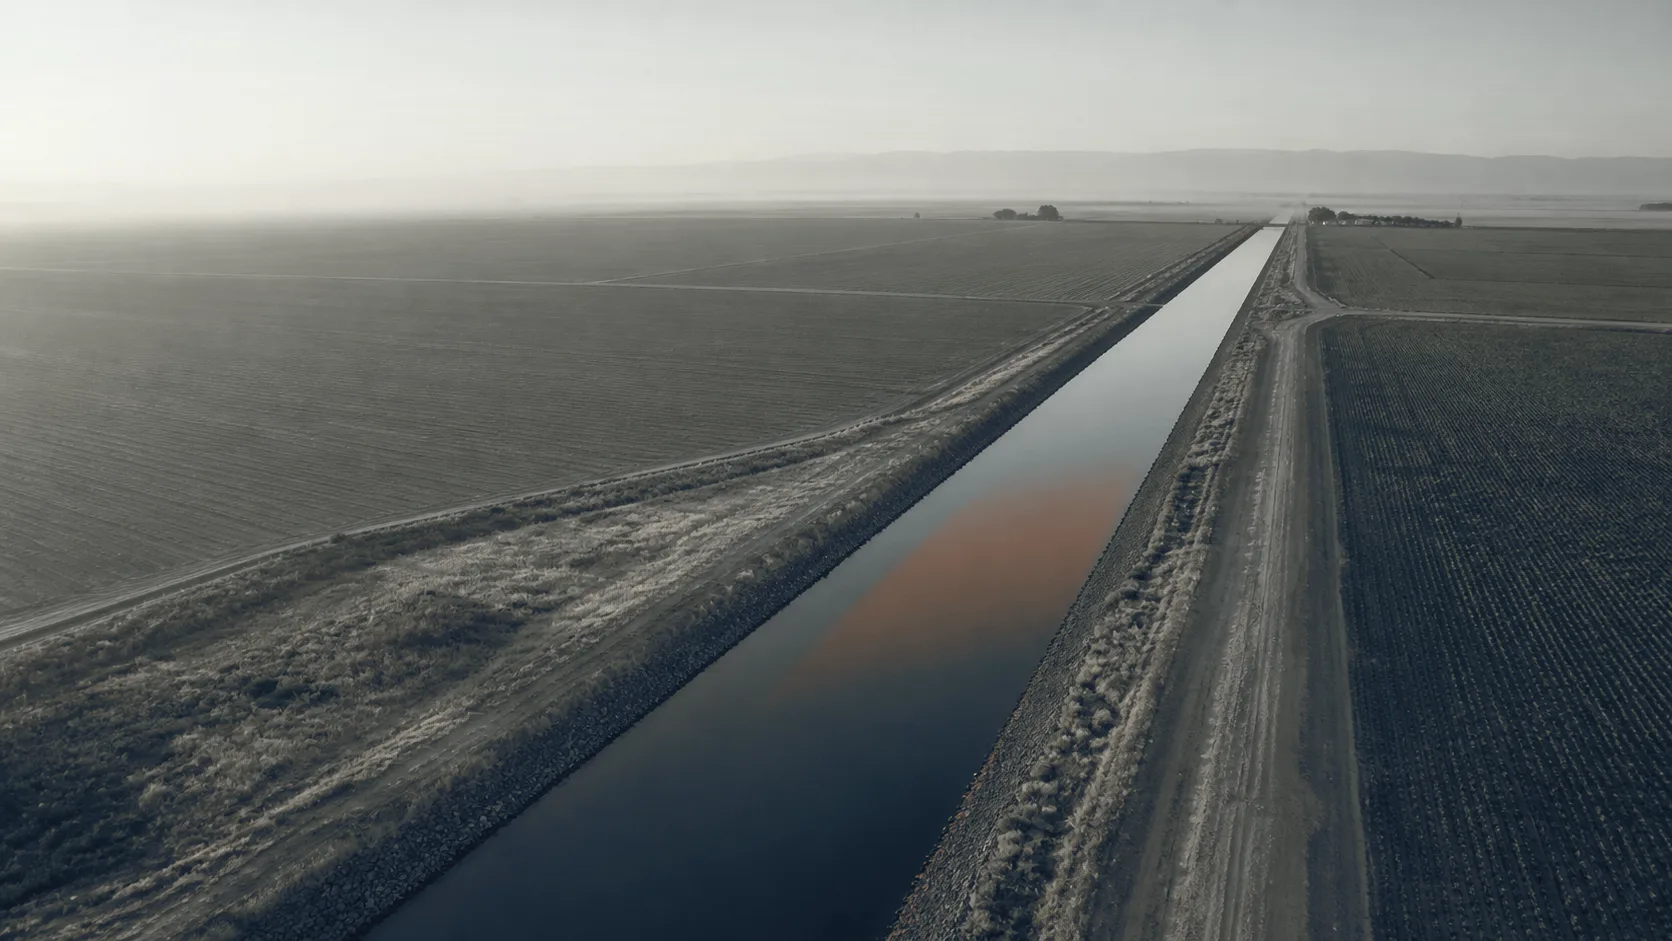
 Illustration
Solution · For irrigation districts and canal companies
Locate canal seepage before you line.
A dawn radiometric thermal flight over a defined reach returns a stationed hotspot map and a ΔT table. Where the bank is losing water, how the candidates rank against each other, and which ones a ditch rider should walk. It locates and ranks loss so lining money goes to the worst reach first. It does not measure a flow rate. Ponding or inflow–outflow measurement does that.
- Aircraft thermal sensor
- 640 × 512
- radiometric
- Spectral band
- 8–14 µm
- longwave infrared
- Capture window
- Dawn
- maximum thermal contrast
- Deliverable
- Stationed map
- PDF + KMZ
What the district already knows, and what the flight adds.
What the district knows is how a reach is assessed today. What the flight adds is what comes back from a dawn flight.
What the district knows
What the flight adds
It’s really hard to quantify how much is really leaking out there
- A stationed hotspot map and a ΔT table locating probable seepage by station, ranked so the worst reach is obvious.
- Ditch-rider knowledge and spot ADCP measurements, which tell you a reach loses water without telling you where along it.
- Loss located to a station and an offset. A crew walks to a place rather than a mile of bank.
- A grant application carried by engineering estimate and historical observation. The after-report built from a different record than the before.
- A baseline you can re-fly, so the application and the verification read from the same document.
areas of constant observation
- An annual re-flight that catches a bank saturating before it moves.
Method
Why dawn, and what the sensor is reading.
How is canal seepage detected from the air?
Seepage detection from the air rests on one fact: water working through a bank carries heat with it. The outer face where it emerges gives up that heat more slowly overnight than the dry ground either side. So by first light it reads warmer, a difference a radiometric sensor resolves easily and the eye cannot see at all. Where a flagged point needs a closer look, that look is taken on the bank with the handheld camera. The flight says where.
Fly at noon and the sun has loaded every slope differently by aspect and shadow. The signal disappears into the weather. Dawn, clear-sky and solar-loading conditions determine timing, and we schedule backup windows. A flight outside its window produces an anomaly list that has to be caveated into uselessness.
When in the season is a canal reach flown?
The flight needs water in the canal, which puts it between spring and fall. A dry-channel model of the same reach is flown separately, in late fall or winter. It registers to the same baseline.
What you receive.
- PDF + KMZ 01 Stationed hotspot map Every candidate located by station and offset along the reach, ready to hand to a crew.
- CSV + GeoPackage 02 ΔT table Each anomaly ranked by thermal difference, with a ground-verification flag against it. Located by canal name and station, plus coordinates.
- GeoTIFF 03 Thermal and visible orthomosaics The same reach in both bands, from the same flight over the same ground.
- PDF 04 Method report Conditions on the day, emissivity and reflected-temperature settings, and the limits of the result.
Stated before you commission it.
Questions we are asked
What buyers ask before they call.
Q1 How much water are we actually losing, and where?
The flight answers the second half precisely and the first half by ranking. You get each probable seepage site located by station and offset, with the thermal difference that flagged it. Ordered worst to least. Converting that into acre-feet takes a flow measurement, by ponding or by inflow–outflow with an ADCP. The map tells your engineer where it is worth putting one.
Q2 Can you show us which reaches to line first?
That is the deliverable. Candidates are ranked by measured thermal difference across the reach. A board looking at a lining budget can see which sections carry the strongest signal. The decision stays yours. Aquifer recharge, access, bank condition and cost all sit outside what a thermal flight can see.
Q3 Will this support a WaterSMART or Aging Infrastructure grant application?
It gives you documentation of where losses are concentrated, produced by a repeatable method with the conditions and settings logged. Programs that ask applicants to locate and quantify losses can use it as evidence toward the locating half. Whether a particular application is satisfied is a question for the program officer, and we do not represent otherwise.
Q4 How does this compare to ADCP flow measurement?
They answer different questions and work well together. An ADCP measures how much water passes a point. A pair of readings brackets a loss across a reach without saying where inside it. The thermal flight places the loss along the reach without measuring the rate. Districts that use both get a located, quantified answer.
Q5 Can you re-fly the same reach next year to show change?
Yes, and it is the point of the first flight. Route, altitude, overlap and camera settings are saved with the deliverable. A re-flight covers the same ground the same way, so the two sets are directly comparable. That is how you show a board whether last season’s repair held.
Q6 What conditions do you need — time of day, season?
Dawn, with water in the canal, between spring and fall. The contrast the method depends on is largest before the sun loads the banks, and it disappears once it does. If cloud, wind or a recent weather event puts the window out of reach, the flight moves. Better that than flown and caveated.
Q7 Is this a survey?
No. Our photogrammetric models document conditions for planning and comparison. They are not land surveys and are not offered as survey-grade or authoritative. Idaho reserves that word to licensed practice. Boundary or certified-elevation work is performed by a licensed Idaho professional land surveyor.
Q8 Does locating seepage mean we should line the whole reach?
Not necessarily, and the map does not argue for it. Seepage in some places recharges the aquifer. That trade-off is a policy question for the district and its water users. What the map gives you is where the loss is concentrated, so whatever you decide is decided on located evidence.
Who this is for
Written for irrigation districts and canal companies.
Next step · One reach
Start with the reach you already suspect.
A short call sizes the reach, fixes the dawn window, and settles what ground verification your ditch riders will do.
We reply within one business day.