
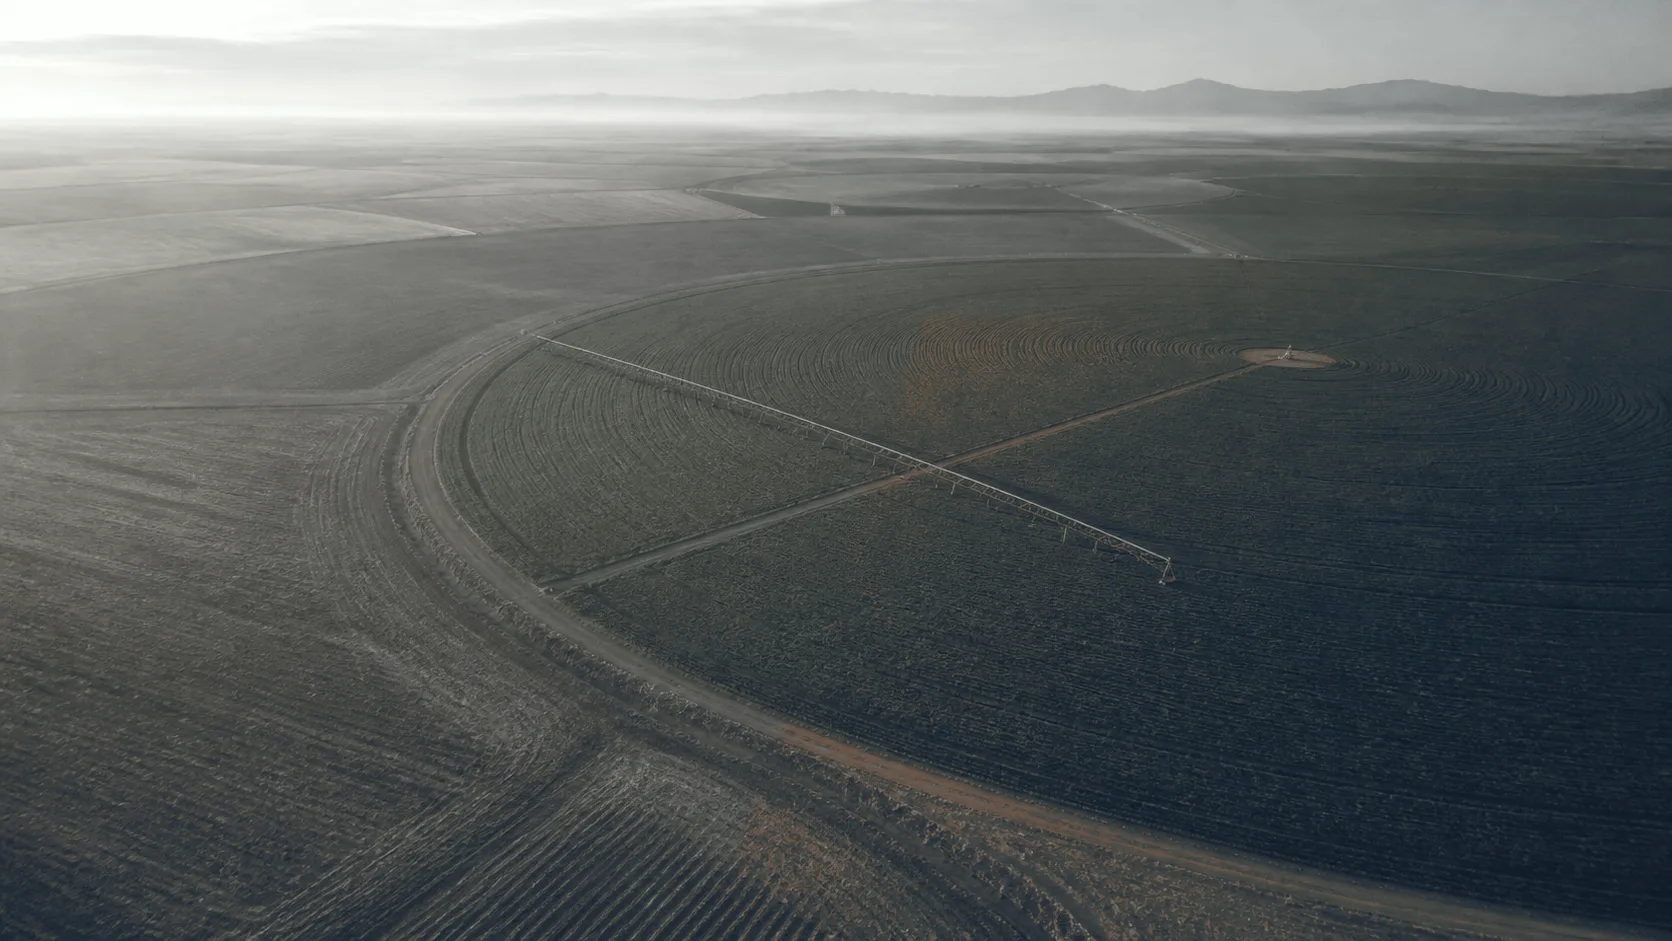
 Illustration
Agriculture
See your field’s stress before the yield drops.
Per-job aerial RGB and thermal imaging for growers and their agronomists. It shows where a field differs from itself, on the day the answer matters. The resolution picks out a single lane. You receive georeferenced imagery and a short read of what the field shows: pivot diagnostics, stand counts, hail documentation.
- Bands flown
- RGB + thermal
- radiometric infrared
- Index
- VARI
- visible-band, from RGB
- Booking
- Per job
- around one question
- Region
- Intermountain West
- Treasure Valley based
Stakes
Routine monitoring is already solved. This is the other work.
Satellite handles season-long trend watching across whole sections at a cost no aircraft matches. What it handles poorly is the narrow case. This field, this week, under cloud, at a resolution that shows one plugged span rather than a soft green blur.
What changes when the field is read from above.
Guesswork
Measurement
- Dry patches nobody had spotted, and soggy zones drowning the roots.
- RGB and thermal showing where the stress starts, bounded by the pivot span or the soil type it sits under.
- Apply extra water to be safe, because the alternative is finding out late.
- The zones that actually need it, identified before the next set goes on.
- React once the crop shows it, which is after the decision that mattered.
- Flown in the window the answer is still useful in — before the irrigation call, not after the yield reports it.
What the imagery can and cannot settle
The comparison is within the field, on one day.
A flight shows where a field differs from itself. A wedge under one pivot span, a headland drying faster than the middle, a stand thinner on one aspect. Bounded by the machine or the soil type, that difference is a place to walk.
What it does not do is name the cause. Water, nutrition, compaction, disease, a plugged nozzle and a pressure loss can all produce the same signature from above. The imagery narrows the search; the agronomist who knows the rotation and the soil closes it.
- Stress wedge · walk it
What you receive.
- GeoTIFF 01 RGB orthomosaic The flown area at a resolution that resolves individual plants and single lanes.
- GeoTIFF 02 Visible-band index map VARI, derived from the RGB camera — a relative indicator of canopy condition within one flight.
- GeoTIFF 03 Thermal stress map Where thermal is flown, the radiometric layer registered to the same coverage.
- Shapefile 04 Zone boundaries and stand counts The areas that differ, delineated in a format your agronomist or FMIS already ingests.
- PDF 05 Annotated report Each flagged area imaged, with the date, conditions and method noted beside it.
How a job runs.
- 01 The question Which fields, what you need to know, and by when.
- 02 Consent and access Written consent, field boundaries, obstructions, and ground to stay off.
- 03 The window Timing is the product — early enough to still inform the decision.
- 04 Delivery Layers processed, zones delineated, conditions recorded with the result.
What this is, stated precisely.
Where this is used
Written for irrigation districts and canal companies.
Next step · One field, one question
Bring one field and one question.
A short call settles which fields and what has to be visible in the imagery. It settles the window it has to be flown in. That includes whether a flight is the right instrument for it at all.
We reply within one business day.