
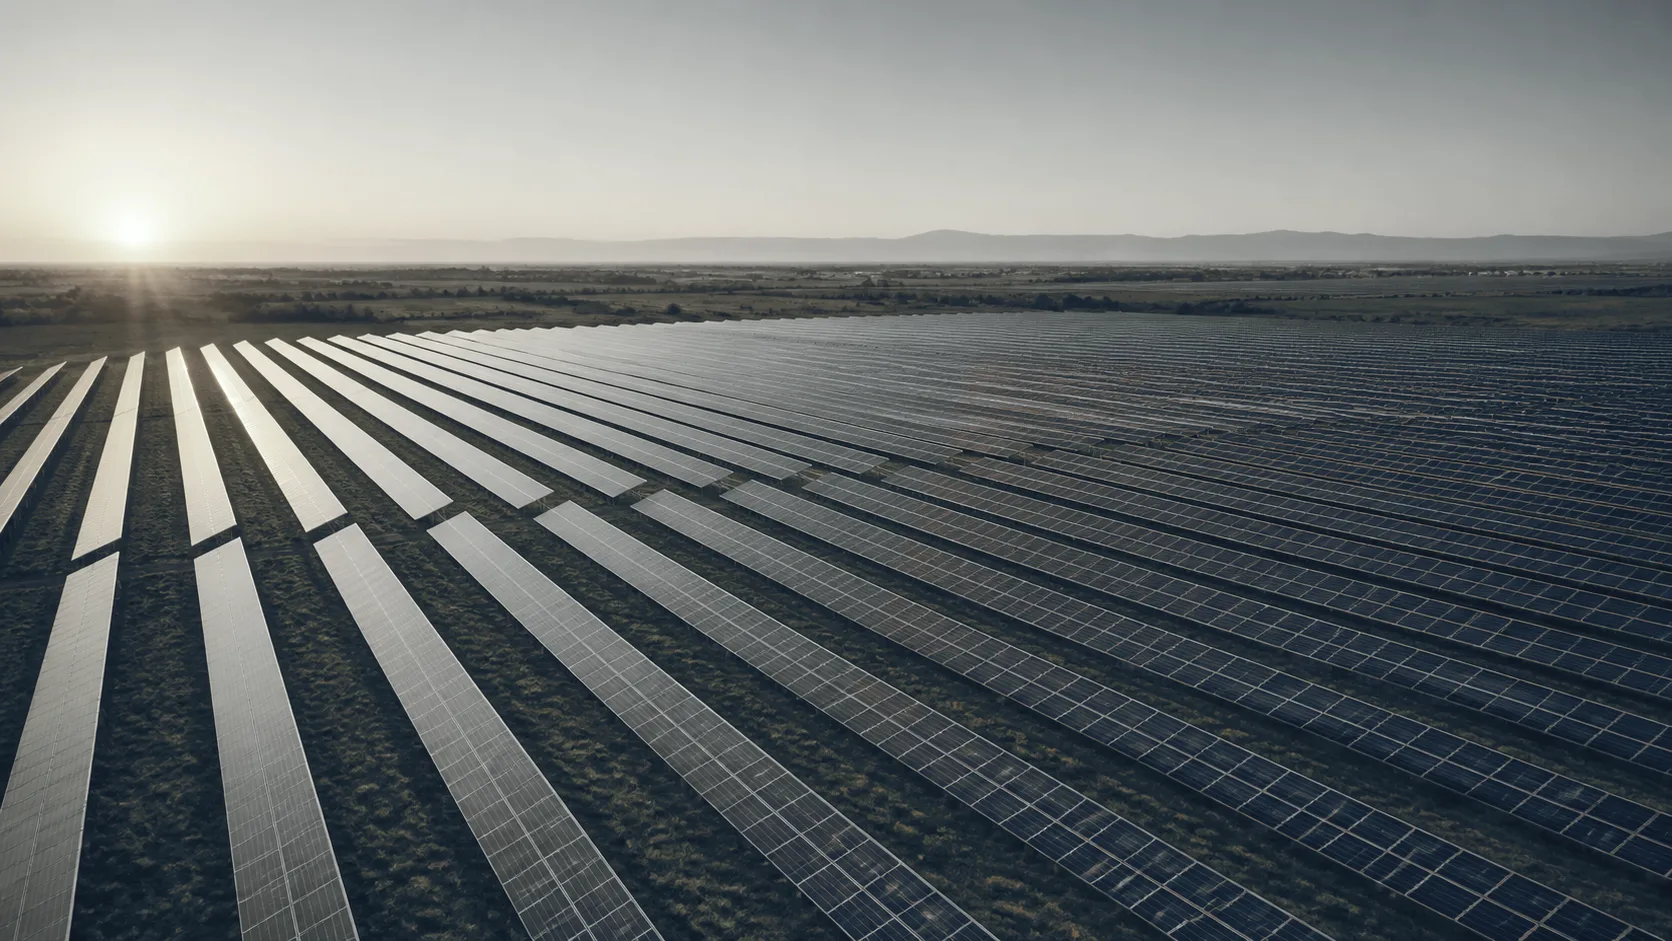
 Illustration
Small commercial · Idaho & the Intermountain West
Find the dead panels from the air.
Aerial thermal and visual inspection of small commercial rooftop and ground-mount solar arrays, for owners and solar contractors. The whole array is read in one flight and mapped module by module, with anomalies classified against IEC TS 62446-3. You receive an anomaly map, a classified findings table and ground follow-up on the flagged strings.
- Method
- IEC TS 62446-3
- 2017
- Aircraft thermal sensor
- 640 × 512
- radiometric
- Irradiance
- ≥ 600 W/m²
- plane of module
- Resolution
- Module-level
- 19 cm/px or finer
Stakes
The array reports a number. It does not report which modules.
An inverter tells you production is down. Walking the array tells you less. A hot cell, a shorted bypass diode and a module that is simply dirty look identical to the eye. Every month that goes by is generation you have already paid for and not collected.
What changes when every module is read individually.
Array level
Module level
- Inverter monitoring reports the array’s total. It rarely reports which modules are responsible for the shortfall.
- Every module flagged individually, categorized against the standard, and located on the array layout.
- Warranty conversations run on subjective visual calls that a manufacturer can decline.
- Radiometric, geotagged data of the kind manufacturers accept, with an RGB frame paired to every anomaly.
- Walking the rows on foot, at voltage, one string at a time.
- The same coverage flown from standoff, in a single pass over the array.
Why the scan is flown under sun and under load
A fault only shows when the current has somewhere to go.
A cell drawing current it cannot pass gives off the difference as heat. So does a failed diode, a degraded interconnect and a warm junction box. Under production, those faults are plain in the infrared from above.
Take the sun away and there is nothing to see. The flight is scheduled to conditions rather than to the calendar. At least 600 W/m² of sunlight on the array, held steady within 100 during the inspection, with module temperature steady within 5 degrees. Beyond that number the guidance is qualitative, and so are we: no moving cloud shadows, low wind, an angle that does not reflect the sky, and not on snow. Module-level resolution, 19 cm per pixel or finer; from the air a single cell is smaller than a pixel. Outside that window the flight moves. Where the flight flags a string, a handheld camera on the ground follows up on it. The combiner and inverter side is read the same way, at ground level.
- Module anomaly from the air · warm cell inside it, from the handheld camera
What you receive.
- PDF + KMZ 01 Module-level anomaly map Every flagged module located on the array layout, so a technician walks to one panel rather than a row.
- CSV 02 Geotagged anomaly list Each anomaly with its module location, its shape, its measured ΔT, and what it is consistent with.
- GeoTIFF 03 Thermal and RGB orthomosaics The same coverage in both bands, from the same flight, registered together.
- JPEG 04 Paired imagery An RGB frame of the same module beside every thermal anomaly.
- PDF 05 Method report Irradiance, cloud, wind and time of flight logged with the result and its limits.
How a job runs.
- 01 Scope Array size, mounting, module count, string layout, and what the report supports.
- 02 Window Flight scheduled to irradiance, cloud and wind — not to the calendar.
- 03 Capture Flown while producing, at an angle that does not reflect the sky, module-level at 19 cm per pixel or finer.
- 04 Classify Anomalies recorded by shape and location, with what each is consistent with, paired and issued.
What this is, stated precisely.
The standard this is written against.
Cited as the framework the report follows. We do not reproduce it.
- IEC TS 62446-3:2017 Photovoltaic systems — outdoor infrared thermography
- Sets out the equipment, the conditions, the procedure, the report and the qualifications of the people doing the work, and includes a matrix for classifying thermal abnormalities, as guidance. We follow that structure. Findings are classified by shape, location and what they are consistent with, with no temperature threshold attached. The severity classes that circulate in this business are individual implementations, and none is published on the standard’s public page.
Where this is used
Written for facility and plant management.
Next step · The underperforming array
Start with the array that is underproducing.
A short call sizes the array and settles roof access and consent. It fixes the irradiance window the flight has to hit.
We reply within one business day.