
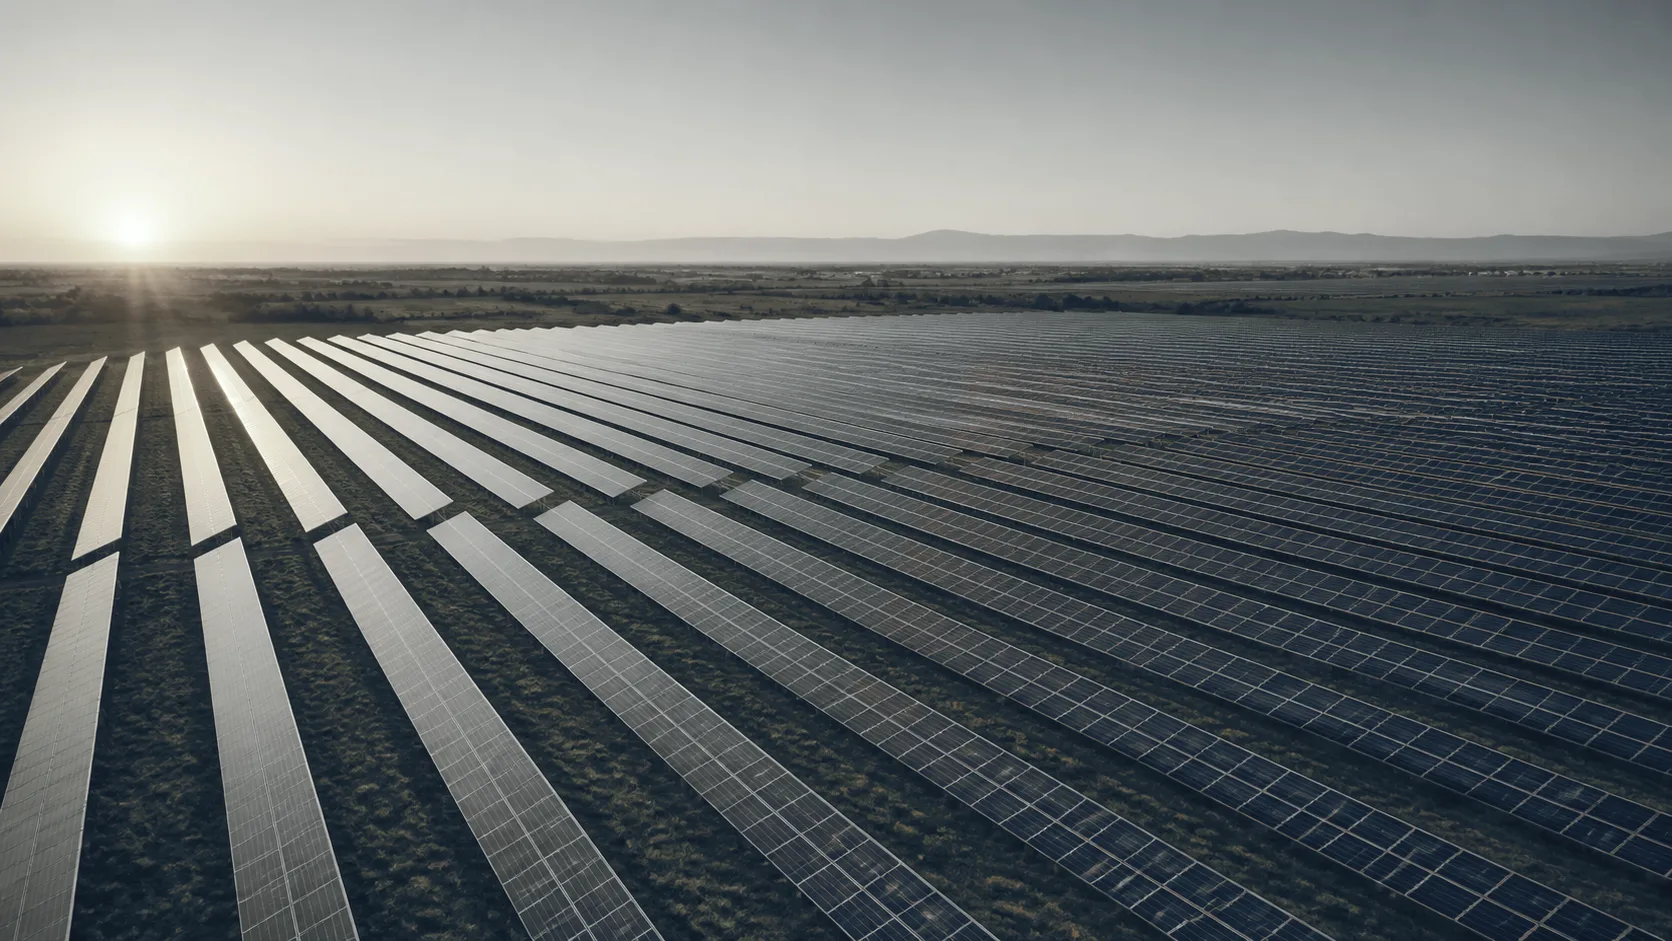
Field notes Solar
What an aerial scan of a solar array finds, and what confirms it
What an aerial thermal scan of a PV array finds, why it resolves a module but not a cell, what the patterns mean, and what confirms them on the ground.
- Topic
- Solar
- Field notes
- Published
- Sep 23, 2026
- Reviewed Sep 2026
- Sections
- 12
- With sources
- Sources
- 10
- Cited in full
Which modules, and is it safe?
An owner with an array on the roof or in the field has two questions. Which modules aren’t pulling their weight? And is anything up there about to fail in a way that matters?
A thermal flight answers the first one well. It’s fast, it covers the whole array in one pass, and it tells you where to send someone. It doesn’t answer the second. That takes a qualified person on the ground with test equipment. This piece is about the line between those two.
What the camera actually sees. Why a flight resolves a module but not a cell. When the flight works and when it doesn’t. What the patterns mean and what confirms them. And what the picture can’t tell you, however sharp it is.
If you came for one thing:
- A cell is smaller than a pixel
- When it works
- What the patterns mean
- What confirms it
- What it can’t tell you
- What you receive
What the camera sees
A solar cell that’s working takes sunlight and turns most of it into current in the wire. A cell that isn’t working takes the same sunlight and turns it into heat. So a cell that’s shaded, cracked, or being bypassed runs warmer than its neighbors. The energy that should have left as electricity is staying put.
That’s what the camera reads. A map of where the power isn’t going.
The array is operating during the flight. It has to be. An array that’s switched off produces no current and no heat pattern, and every module reads the same.
Here’s the catch, and it’s the same catch as every other kind of thermal work. A warm cell tells you energy is being lost there. It doesn’t tell you why. A cracked cell. A shadow from a vent stack. A bird dropping. A reflection of the sun off the glass. A cell that’s simply weaker than the one beside it. From above, all of them can read as the same warm spot.
A thermal pattern is a symptom, and the field literature is direct about that. Matching the pattern to an electrical cause takes a measurement, not a second look at the image.
So we don’t report defects. We report patterns, located, with what each one is consistent with. What it actually is gets confirmed on the ground.
A cell is smaller than a pixel
Here’s the number that decides what a flight can and can’t see.
NREL’s operations and maintenance guidance sets the resolution for aerial thermal inspection at 19 centimeters per pixel, or finer. A standard solar cell is about 15 centimeters across. At the resolution the guidance names, one cell is smaller than one pixel.
That’s not a flaw in the method. It’s what the method is for. From the air you see the module, about a meter by two, clearly. You see a substring, one of the three sections a bypass diode controls, clearly. You see a whole string of modules that’s warmer or cooler than the strings beside it. Those are the faults that matter most to production, and they’re the ones the flight finds fast.
A single hot cell, from the air, is a warm dot. It’s often visible. It isn’t resolvable. You can’t see its shape or its edges. You can’t tell whether it’s one cell or the corner of two.
You’ll see “3 centimeters per pixel for cell-level detail” quoted. That’s a real number from the same NREL guidance. It’s the resolution for the visible-light camera, not the thermal one. The two cameras have different sensors and different specs. The smaller number belongs to the one that doesn’t read heat.
A field study that ran both methods on the same plant found what you’d expect. Aerial and handheld both found open modules and open substrings. The handheld camera, a meter from the glass, showed the irregular patterns sharper because it was closer.
The flight finds the module. The walk finds the cell.
That’s the honest division. The flight covers an array in a morning and tells you which of a thousand modules to look at. The handheld camera, and the tests that follow it, tell you what’s wrong with the twelve you walked to.
When it works
The array has to be producing, and the sun has to be doing the work.
NREL’s guidance puts the floor at 600 watts per square meter of sunlight on the array. It should hold steady within 100 during the inspection, with module temperature steady within 5 degrees. Below that, the difference between a working cell and a failing one shrinks into the noise. Changing fast, and the pattern you’re reading is the weather, not the module.
Beyond that number the guidance is qualitative, and so are we.
No moving cloud shadows. A cloud passing over half the array in the middle of a pass gives you two arrays that don’t compare.
Low wind. Wind cools every module the same, and flattens the differences.
An angle that doesn’t reflect the sky. Glass reflects. Point the camera wrong and you’re reading the sky’s temperature, or the sun’s.
Not on snow. A snow-covered module produces nothing and reads nothing. NREL’s guidance notes snow tends to stay on arrays tilted under about 30 degrees until it melts. It doesn’t recommend removing it.
Every flight gets a log. Irradiance, wind, module temperature where measured, time of day, camera angle. It’s what lets next year’s flight be compared to this one.
What the patterns mean
A thermal image of an array is a set of shapes. The shape tells you the scale of what’s wrong, and it narrows what could be causing it. It doesn’t name the cause.
Here’s the hierarchy, smallest to largest.
Part of one cell. A corner or an edge warmer than the rest. Consistent with a local resistance, current crowding near a crack, or a solder or interconnect defect. Or a small shadow or contaminant on the glass.
One whole cell. The classic hot spot. A cell that’s being driven in reverse by its neighbors because it can’t keep up. Consistent with shading, soiling, a cell defect, or a crack that’s cut off part of the cell.
Several cells, scattered. A patchwork. Random warm cells across a module with no pattern to their placement. Consistent with distributed cell damage, with manufacturing variation, or with potential-induced degradation. It’s also what a lot of things look like, so patchwork alone proves none of them.
One substring. A third of the module, uniformly warmer or cooler than the other two-thirds. Most modules have three bypass diodes, each protecting a third of the cells. A substring that’s uniformly different is one whose diode is active or has failed. Or one with an open connection. A field report on module failures puts the arithmetic plainly. On a three-diode module, one shorted diode takes a third of the module’s output.
A whole module. Uniformly warmer than the modules around it. Consistent with an open-circuit module producing nothing, or a module that’s been bypassed entirely. Or a module of a different type installed in the same string.
A whole string. A row of modules all reading different from the rows beside them. Consistent with an open string, a blown fuse, a disconnected conductor, or an inverter channel that isn’t loading it.
A junction box or connector. A warm point at the back edge of a module or at a plug between modules. Consistent with a high-resistance connection or a diode carrying current it shouldn’t be.
Each of those gets recorded as what it is: a shape, at a location, with the causes it’s consistent with. The shape is the finding. The cause is the next step.
What else makes a hot spot
Every shape above can also be produced by something that isn’t a fault. The flight can’t always tell them apart. The ground usually can.
A reflection. Glass reflects sky, sun, and nearby warm surfaces. A reflection moves when the camera moves. A hot cell doesn’t.
A shadow that was there for one pass. A vent stack, a parapet, a tree, a cloud edge. The cell under it reads warm because it’s being bypassed, and it’s fine as soon as the shadow moves.
Soiling in a pattern. Dust that’s collected along the bottom edge of every module in a row. Bird droppings on one cell. Both shade the cell, both make it warm, and both wash off.
Two module types in one array. A replacement module from a different production run, or a different manufacturer, reads different from its neighbors. Same sun, different module. It isn’t failing. It’s different.
A module that’s just weaker. Modules come off the line with a spread. One at the low end of the spread, next to one at the high end, reads warmer. That’s not a defect. It’s a distribution.
That’s why the visible image travels with the thermal one. A bird dropping, a shadow, and a replacement module are all obvious in the daylight photo. You rule those out before anyone climbs a ladder.
What confirms it
The flight hands your electrical contractor a list of locations and shapes. Here’s what turns a shape into a diagnosis, and who does it.
Look at it. Walk to the module. Glass damage, a dropping, a shadow source, a loose plug, discoloration. A lot of shapes resolve here with no instrument at all.
Read the monitoring. If the array has string-level or module-level monitoring, pull the data for the anomaly’s location. A string that’s underproducing electrically confirms a thermal string. A module the monitoring says is fine, under a warm spot, points at an optical cause. A reflection or a shadow, not an electrical fault.
Trace the I-V curve. The definitive electrical test for a string or a module. It shows whether a substring is bypassed, whether a module is open, whether the string is mismatched. It normally requires isolating the string from the inverter.
Image it in the dark. Electroluminescence drives current into the module in darkness and photographs the glow. Dead cells and cracks show as dark areas. It’s the test that actually sees a crack. It needs the module disconnected and externally powered, so it’s a specialist visit.
Handheld thermal, up close. The same camera a meter from the glass sees the shape the flight couldn’t resolve. Whether a warm dot is one cell or a crack across two.
Now the boundary, and it’s the same one as every other note on this site.
We image from outside. Your qualified technician opens enclosures. A thermal flight reads an operating array without touching it. A handheld camera at the module does the same. Opening a combiner box, a junction box, or an inverter cabinet on an energized system is electrical work. It’s done by qualified people under your site’s electrical safety program, in the protective equipment that program calls for. Often it means shutting the system down. Shutting it down also removes the heat pattern you were trying to look at. That’s a real trade-off, and the plan for the day has to account for it.
What it can’t tell you
Plainly, so it’s settled before the flight.
Why. A warm cell is a symptom. The cause is one of a dozen things, and the image doesn’t pick.
How many watts. Temperature difference doesn’t convert to power loss. A whole string that’s out is a loss you can compute from the string’s rating. A single warm cell isn’t.
How long the module has left. A field review of module failures says it directly. There’s no method to tell whether an existing crack will lead to power loss or not. A pattern today isn’t a forecast.
Whether it’s covered. Warranty is a contract question. It depends on the terms, the product records, the confirmed failure mode, and the manufacturer’s process. A thermal image starts none of that.
Whether it’s safe. A hot spot can be a nuisance or a fire path. The difference is in the component, its location, and the material around it. How long it’s been that way, and where the current is going. That’s an electrical assessment, on site.
Cracks. The camera may see heating near a crack. It doesn’t see the crack. Electroluminescence does.
Degradation from voltage stress. A patchwork pattern can be consistent with it. So can several other things. Consistent with isn’t proof of.
The roof underneath. An array on a roof sits over membrane, flashing, and insulation. A flight over the modules reads the modules. What’s happening to the roof under them is a different scan with different access. We say so rather than imply the one covers the other.
What the flight does give you is a map. Every module that reads different from its neighbors, located to the string and the module. The shape recorded, and the causes it’s consistent with. That’s what sends a technician to twelve modules instead of a thousand.
Where the standard fits
Our procedure follows IEC TS 62446-3, the technical specification for outdoor infrared thermography of photovoltaic modules and plants in operation. The current edition is from 2017, and it’s the one that stands. A revision was started and cancelled in 2025. Every report states the edition it was worked to.
The specification covers the equipment, the conditions, the procedure, the report, and the qualifications of the people doing the work. It includes a matrix for classifying thermal abnormalities, as guidance. We follow that structure. We don’t reproduce it here, and following it isn’t a certification.
One thing worth knowing. The severity classes that circulate in this business are individual implementations. Three tiers, with temperature cutoffs and repair deadlines. They don’t agree with each other, and none of them is published on the standard’s public page. We classify findings by shape, location, and what they’re consistent with. We don’t attach a temperature threshold, because we couldn’t find one to cite.
What you receive
The report is built around the standard’s reporting scope, stated as what we deliver.
An array map. Every anomaly located to its string and its module, using the array’s own numbering. If the site has no numbering, we build one. It goes in the report so the next inspection uses the same map.
Image pairs. A radiometric thermal image and a visible-light image of every anomaly, from the same pass. Your reviewer can re-measure any point in the thermal file. The visible one is what rules out the bird dropping.
Conditions. Irradiance during the flight and how much it moved. Wind. Ambient and module temperature where measured. Time of day, camera angle, flight altitude.
For every anomaly: its shape, from the hierarchy above. Its location. What it’s consistent with. What would confirm it — a look, the monitoring data, an I-V trace, an EL image. And a provisional class, by shape and extent, with the note that it isn’t a diagnosis.
What couldn’t be seen. A module whose back can’t be reached. A section under a shadow for the whole flight. A row that was snow-covered. Marked as not inspected, with the reason. Not left off the map.
The map and the image pairs are the deliverable. The classes are a way to sort them. The diagnosis comes from your technician, with the tests described above.
If you want to talk about an array
A short call covers three things. The array: how many modules, how they’re laid out, roof or ground, and whether there’s a numbering scheme. Whether there’s monitoring data, and at what level. And who your electrical contractor is. They’re the ones who open enclosures and run the tests that turn our map into their work list.
We’re owner-operated. The person you talk to is the person who flies the array and signs the report.
If your array is under snow, or it’s a cloudy week, we’ll tell you to wait. A flight on the wrong day produces a report that looks fine and isn’t.